
Where TablePro 0.88 got faster
Ngô Quốc Đạt
On this page
Most of my time on TablePro 0.88 went into speed. It's in beta now. On a database 200 ms away, a MySQL query with the row limit comes back in 214 ms instead of 830. A 66 MB result crosses an SSH tunnel in 0.68 seconds instead of 8.9. A 642-statement PostgreSQL dump imports in 8.6 seconds instead of two minutes and 18.
Every number here compares 0.87.0 with 0.88.0-beta.2 on the same Mac and the same data. How I measured is at the end.
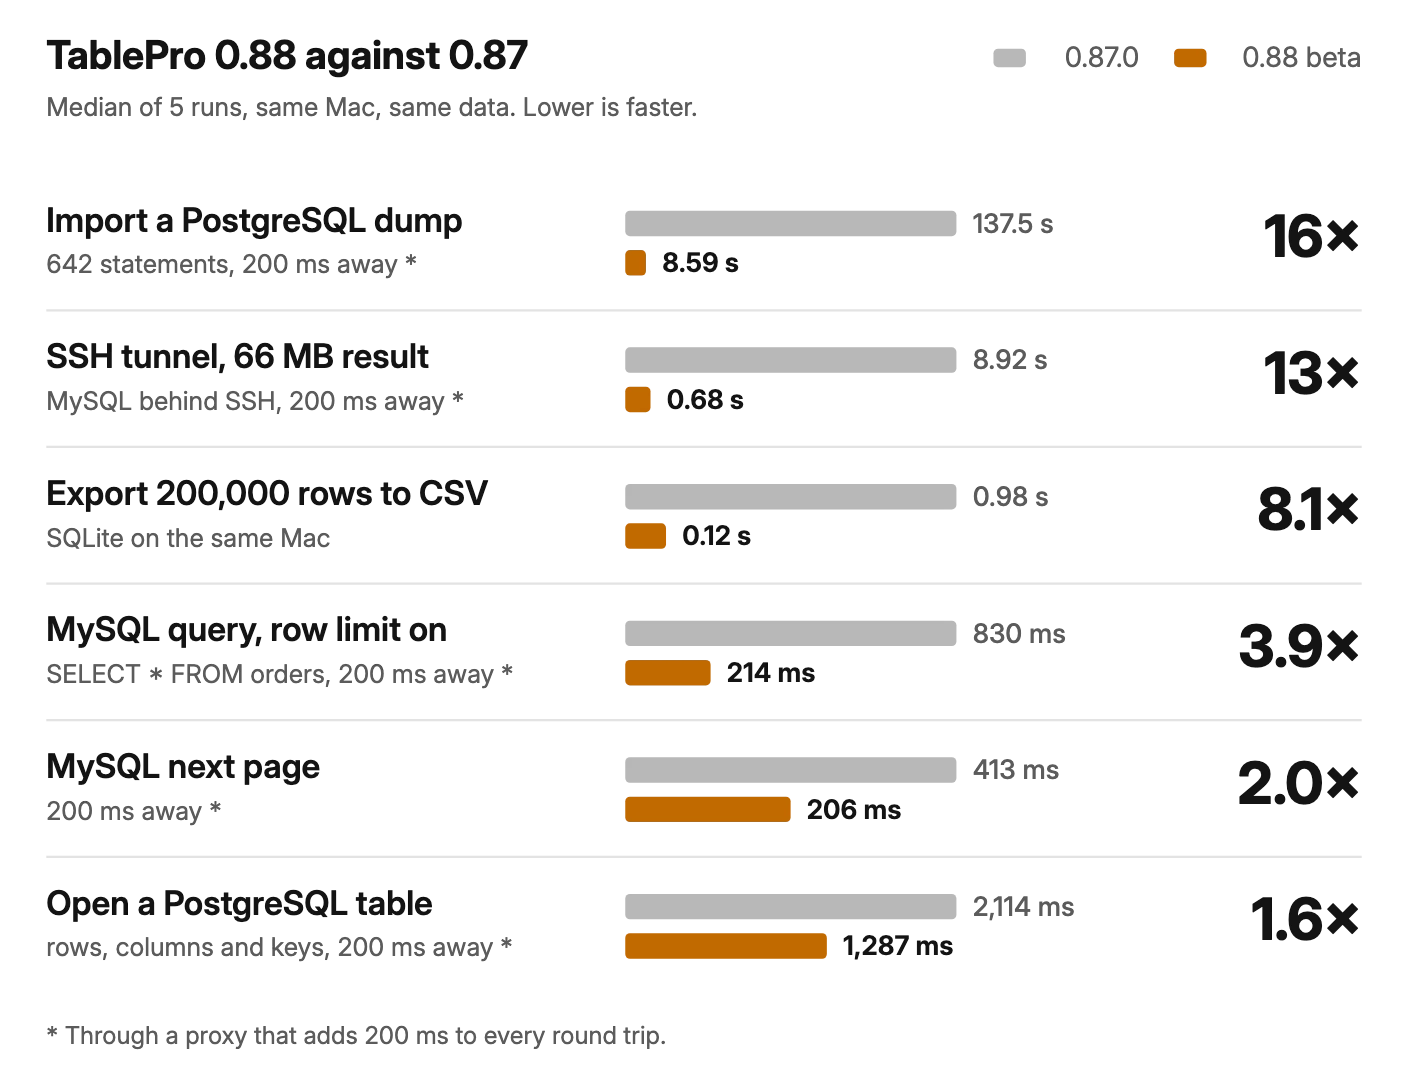
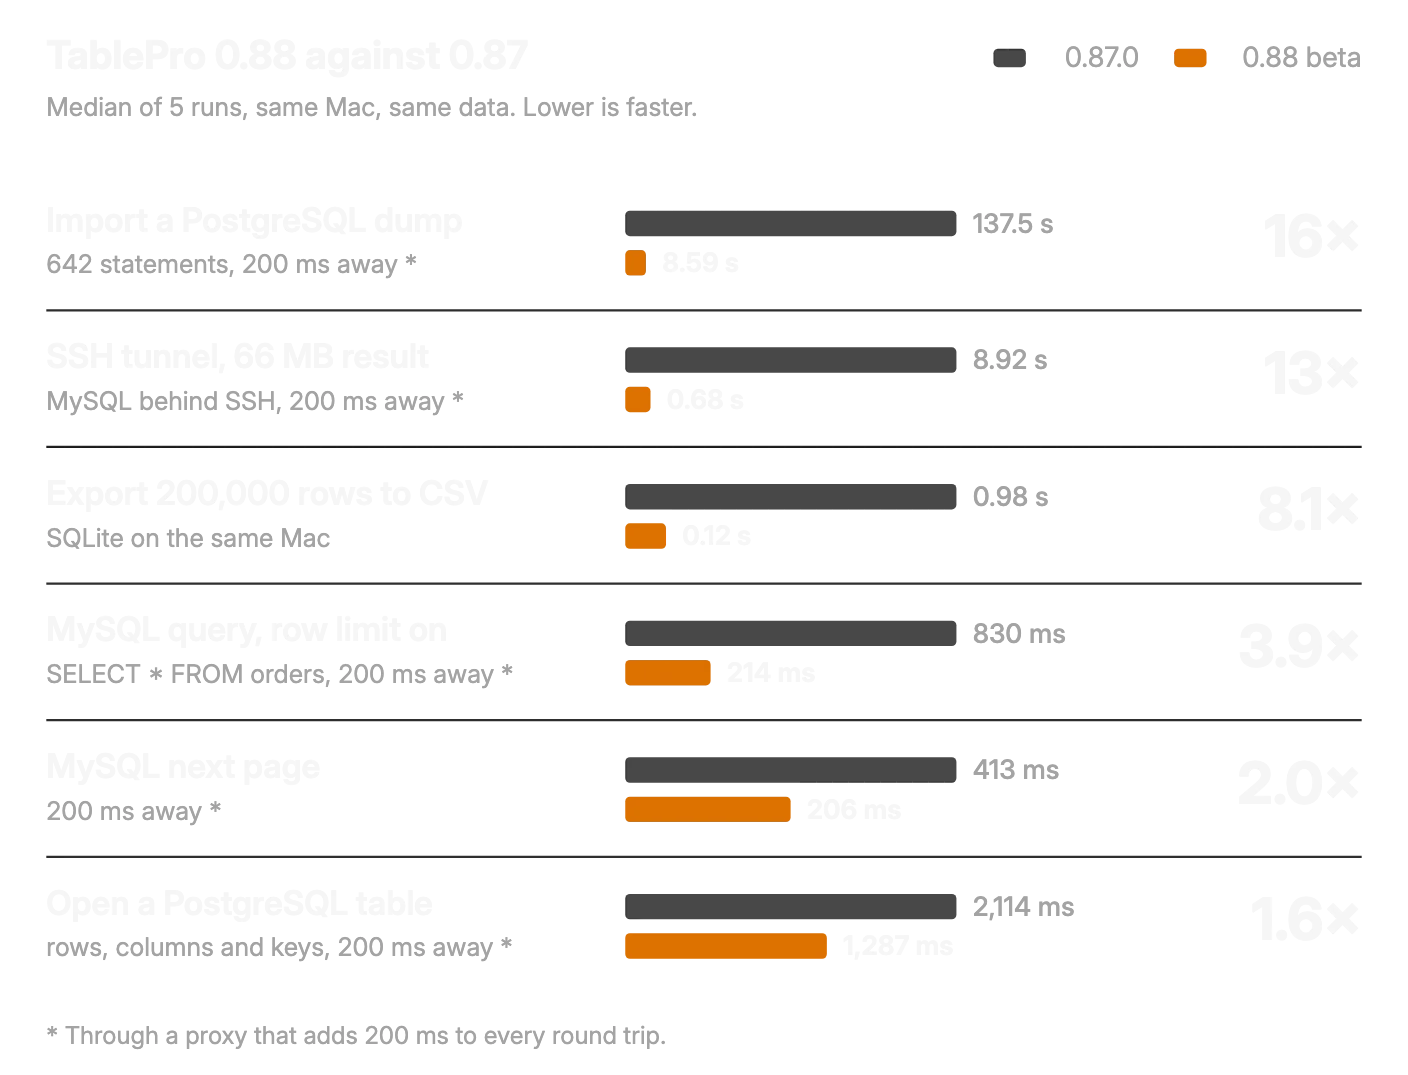
| What you do | 0.87.0 | 0.88 beta | Faster |
|---|---|---|---|
| Import a PostgreSQL dump, 642 statements * | 137.5 s | 8.6 s | 16x |
| Read a 66 MB result through an SSH tunnel * | 8.9 s | 0.68 s | 13x |
| Export 200,000 rows to CSV | 0.98 s | 0.12 s | 8x |
SELECT * FROM orders on MySQL, row limit on * |
830 ms | 214 ms | 3.9x |
A MySQL query with its own LIMIT * |
411 ms | 204 ms | 2x |
| Next page of a MySQL table * | 413 ms | 206 ms | 2x |
| Open a PostgreSQL table * | 2.11 s | 1.29 s | 1.6x |
* 200 ms away, through a proxy that delays every packet.
Round trips, not queries
#When your database is far away, most of the wait isn't the database working. It's messages crossing the network. From Vietnam to a server in the US, each trip there and back costs about 200 ms, and TablePro was making trips it didn't need.
Here's what 0.87 sent to MySQL to run SELECT * FROM orders with the default row limit, read from the proxy's log:
SET SQL_SELECT_LIMIT = 18446744073709551615;  -- lift the limit for the next line
USE `shop`;                                   -- make sure we're on your database
SET SQL_SELECT_LIMIT = 10001;                 -- cap your query at 10,000 rows
SELECT * FROM orders;
Four statements, and each one waited for the server before the next went out. That's four round trips, 830 ms, for a query the server answers in under a millisecond.
0.88 keeps track of which database the session is on and skips the USE when nothing could have moved it. With no USE, there's nothing to lift the limit for. The limit and your query go out together:
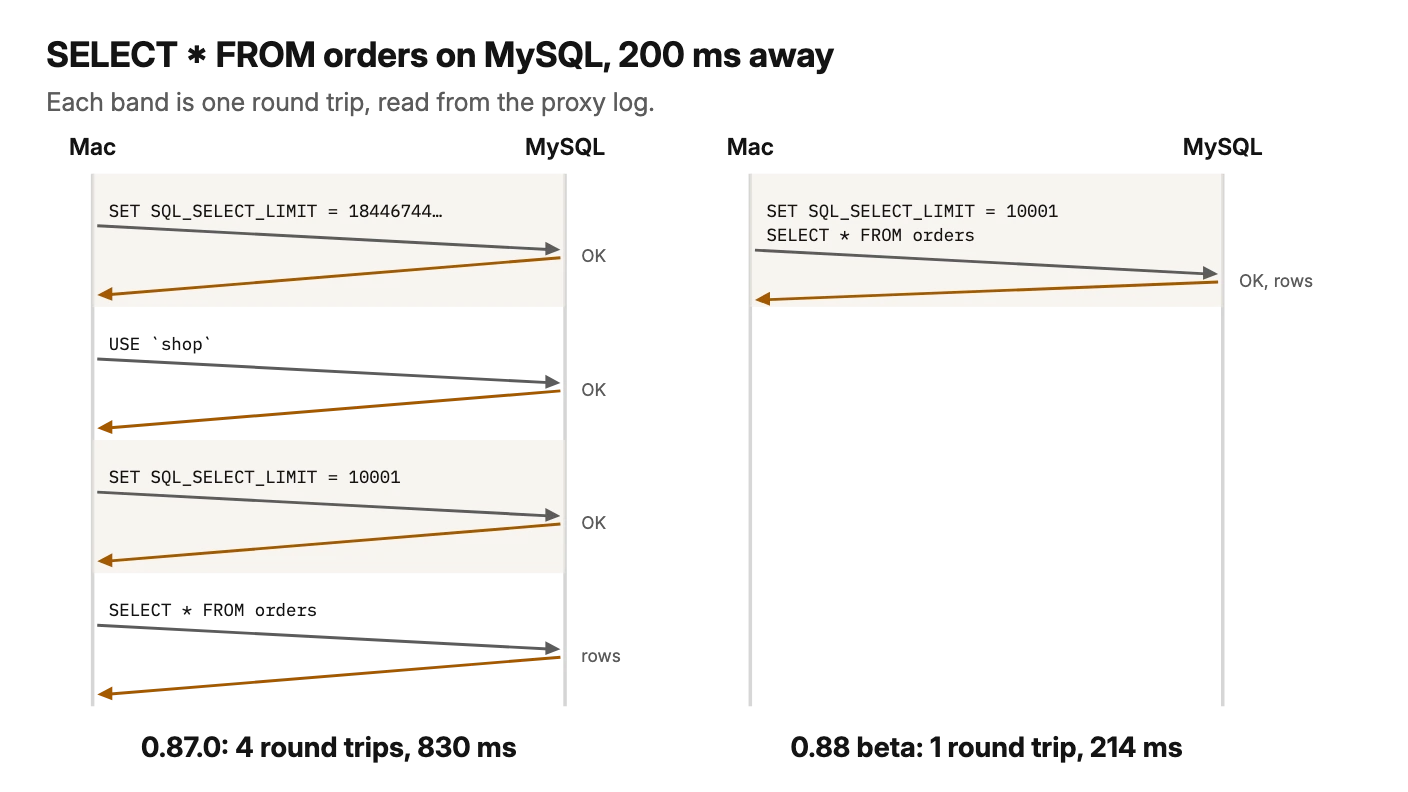
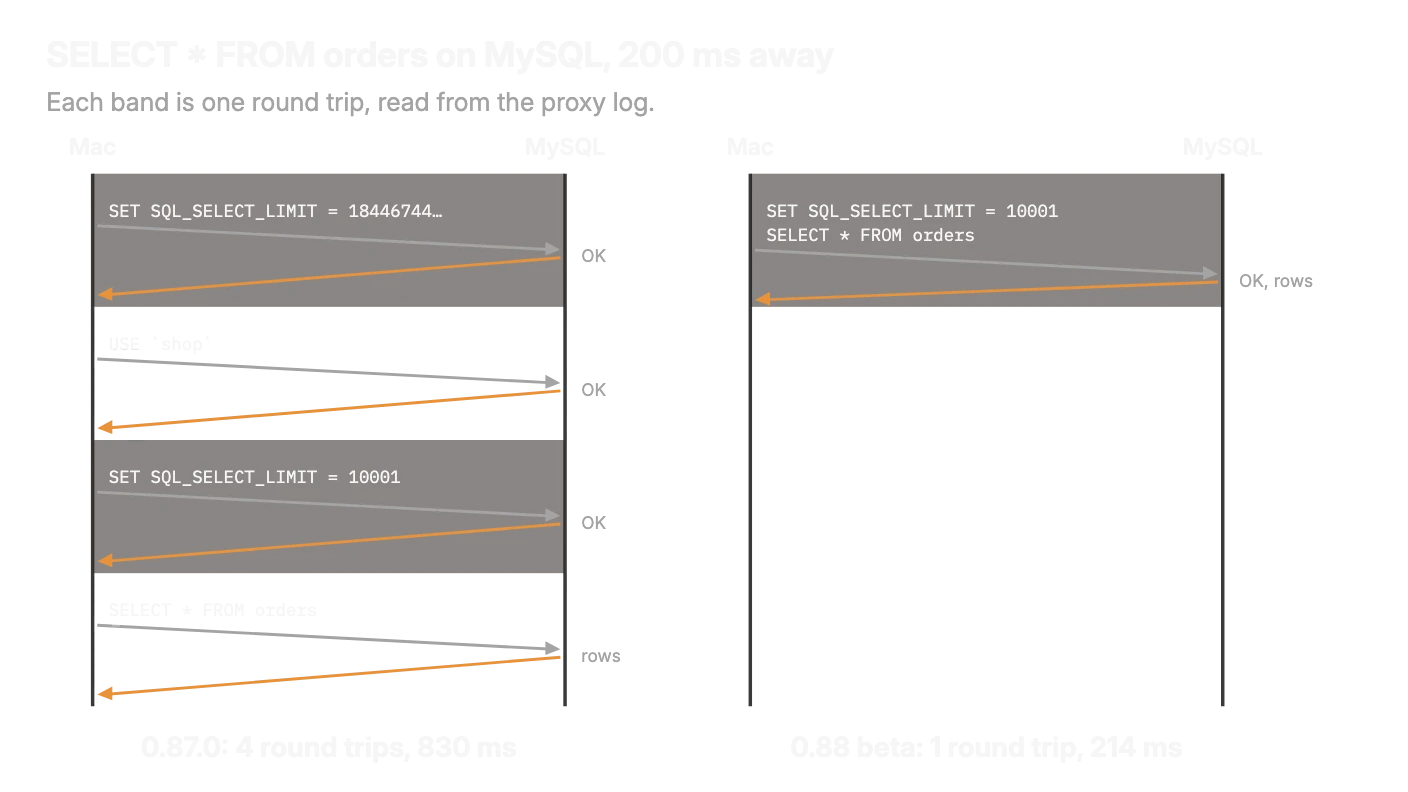
The same trick halves paging. Next page was a USE plus the page query, 413 ms. Now it's the page query alone, 206 ms. A side effect I like: ROW_COUNT() and SHOW WARNINGS now answer for your last statement instead of for a USE you never typed.
PostgreSQL had the same problem in a different place. Opening a table showed its first rows after one round trip in both versions, about 205 ms. What came after was slow: reading the table's columns took five queries, one after another, 1,040 ms. 0.88 sends the five together, 216 ms, and the whole open, with keys and the row count, went from 2.11 to 1.29 seconds.
A wider SSH window
#An SSH tunnel carries data in channels, and each channel has a window. The server may send that many bytes, then it has to wait until TablePro says it has room for more. libssh2 opens tunnel channels with a 2 MB window. Over a 200 ms link that's a ceiling you can't get past: 2 MB per 0.2 s is 10 MB/s, however fast your connection is. 0.87 moved 7.4 MB/s.
0.88 opens its tunnel channels itself, with a 32 MB window:
libssh2_channel_open_ex(
    session, "direct-tcpip", 12,
    33_554_432,  // receive window, 32 MiB instead of libssh2's 2 MiB
    32_768, message, messageLength)
A SELECT returning 66 MB of rows took 43 round trips in 0.87 and 4 in 0.88. It now takes 0.68 seconds instead of 8.9, about 96 MB/s.
The cost is memory: a tunnel whose reader stalls can now hold up to 32 MB per channel before the server stops sending.
Importing a dump in batches
#A SQL import sent one statement, waited for the answer, then sent the next. A pg_dump --inserts file of 642 statements meant 661 round trips. At 200 ms each, that's over two minutes of waiting for a file that's 59 KB.
0.88 uses libpq's pipeline mode for PostgreSQL. With Wrap in transaction on, it sends up to 200 statements or 4 MB at once, then reads the answers. Simplified:
PQenterPipelineMode(conn)
for statement in batch { PQsendQueryParams(conn, statement, ...) }
PQsendPipelineSync(conn)
// then read one result per statement
The first failure still stops the import at the right line and rolls the transaction back. The same file now takes 37 round trips and 8.6 seconds instead of 137.5. TablePro's own import dialog says 133 and 4.5 seconds. The times here also count the sidebar refresh that runs after an import. MySQL imports still go one statement at a time.
Exports that skip work
#This one has nothing to do with the network. The CSV exporter wrote every value with its own small write and ran the quoting rules on every value, even plain numbers. 0.88 buffers 1 MB between writes and scans each value's bytes first: when nothing needs quoting, the value goes out as is. JSON got the same treatment.
Exporting 200,000 rows of a local SQLite table went from 0.98 to 0.12 seconds, and both versions wrote the same 15.8 MB file, byte for byte. Both still take about two seconds after you press Save before the first byte is written, which I haven't looked at yet.
What it cost, and what didn't change
#- An SSH tunnel can hold more memory when its reader stalls, and a Parquet export of a huge table spends a little more CPU to stay under a memory cap. Both are trades I made on purpose.
- On a database on your own Mac or LAN, a round trip costs well under a millisecond, so the network gains mostly disappear there. The export gains don't depend on the network.
- MySQL imports still send one statement at a time.
- Opening a MySQL table got only a little faster, 1.10 to 0.88 seconds. Its first page now shows in 205 ms instead of 411, but the metadata reads after it still take three more round trips.
How I measured
#- A Mac mini with an M4 Pro and 24 GB of memory, macOS 27.0.1.
- MySQL 8.4.13, PostgreSQL 17.12 and OpenSSH 10.3 in Docker on the same Mac.
- Every connection goes through a small proxy that holds each packet for 100 ms in each direction, so every round trip costs 200 ms. For the SSH test, the delay sits on the SSH link and MySQL is behind it.
- 0.87.0 from its GitHub release and 0.88.0-beta.2, each in its own clean profile, against the same data.
- One warm-up run, then five measured runs. The tables show the median. Fastest and slowest runs of a test were within 8% of each other, except the CSV export on 0.87, which varied by 20%. Network times run from the first byte TablePro sends to the last byte it receives, read from the proxy's log, and round trips are counted from the same log.
The changes, each with its own notes and benchmarks, are in pull requests #4328, #4331, #4333, #4341 and #4356.
Trying it
#0.88 is in beta. Turn it on in Settings > General > Update channel, pick Beta, and check for updates. If something is still slow for you, open an issue with the database, roughly how far away it is, and what you did.
Available for Mac, Linux, iPhone and iPad.
Download